
Has Penn State made progress with student, faculty diversity? Check out the numbers
Fulfilling a promise months in the making, Penn State President Neeli Bendapudi announced this week the release of a dashboard to track progress relating to the university’s diversity, equity, inclusion and belonging.
The reporting tool, available online at opair.psu.edu/deib-dashboard/, monitors student and employee metrics by race and ethnicity, covering topics like undergraduate enrollment, graduation rates and faculty composition. Available data mostly cover a five-year period stretching through the 2018 and 2022 academic years, plus student graduation figures from the last decade.
“We strategically focused the dashboard on metrics that directly support the four DEIB-focused goals outlined by President Bendapudi, to collect and track information from across the institution in one central location,” Carly Sunseri, director of data science within Penn State’s Office of Planning, Assessment and Institutional Reporting, said in a statement. “This level of transparency will move us closer to the president’s goals to create greater knowledge of who we are as a community and where we need to grow and improve across the University.”
The DEIB dashboard is the latest public-facing step in Penn State’s recent commitment to equity and racial justice, which was scrutinized in late 2022 after the university scrapped plans for a racial justice center at the University Park campus.
Bendapudi, Penn State’s first president to be either female or a person of color, has asked for patience from the community as her administration charts a path forward amid other struggles, including an ongoing budget crisis.
From declining enrollment to improving graduation rates, here’s what Penn State’s newly compiled data says so far.
Faculty diversity growth deviates
While some ethnic groups and underrepresented populations within Penn State’s faculty saw representation gains between the fall 2018 and fall 2022 semesters, others took a step back.
According to Penn State’s dashboard, white faculty members make up approximately 66% of university faculty as of the fall 2022 semester. Asian-identifying faculty (808) check in as the second-most-represented group, while those who did not specify their race or ethnicity follow with 472 representatives.
Generally, faculty representation for most ethnic and racial groups peaked in the fall 2020 semester, according to the dashboard. Since then, most groups’ numbers have slightly declined, though Asian, Hispanic or Latino and international representation has steadily increased across Penn State’s campuses.
Just one native Hawaiian or Pacific islander-identifying faculty member is represented for the fall 2022 semester, according to the dashboard, marking the university’s least-represented group. Multiracial (47) and American Indian or Alaska native-identifying faculty members (16) follow close behind.
Penn State’s faculty population peaked in the fall 2020 semester with 6,466 faculty members. That figure decreased by 70 by the time the fall 2022 semester rolled around, marking a drop of about 1.1%.
Overall, the number of international faculty members increased by 33% between the fall 2018 and 2022 semesters, marking the largest gain of any demographic group. Faculty members identifying as Hispanic or Latino (17%), Asian (12%) and Black or African American (7%) saw significant gains in the five-year period, too.
Faculty representation data changes significantly when examining tenure-line faculty and non-tenure-line faculty, according to university data. Non-tenure-line Black or African American faculty increased from 86 representatives in the fall 2018 semester to 99 by the fall 2022 semester, marking a 15% increase. However, the number of Black or African American tenure-line faculty practically flatlined in that period, moving from 107 members in the fall 2018 semester to 108 in the fall 2022 semester.
While the sample is small in scope, data from Penn State’s DEIB dashboard support the conclusions drawn from a landmark, two-part report in 2020 that brought national attention to the challenges Black faculty faced throughout the university.
The report, titled “More Rivers to Cross,” concluded Black faculty rates at the university stayed practically flat over a 15-year period while non-Black faculty rates increased. A second installment, published in 2021, summarized racial discrimination experienced by Penn State faculty.
A fall 2020 report from the National Center for Education Statistics found white faculty members represented approximately 74% of full-time faculty across the country. Asian faculty (12%) followed with the second-most representation before Black and African American faculty (7%) and Latino or Hispanic faculty (6%).
As enrollment declines, graduation rates are up
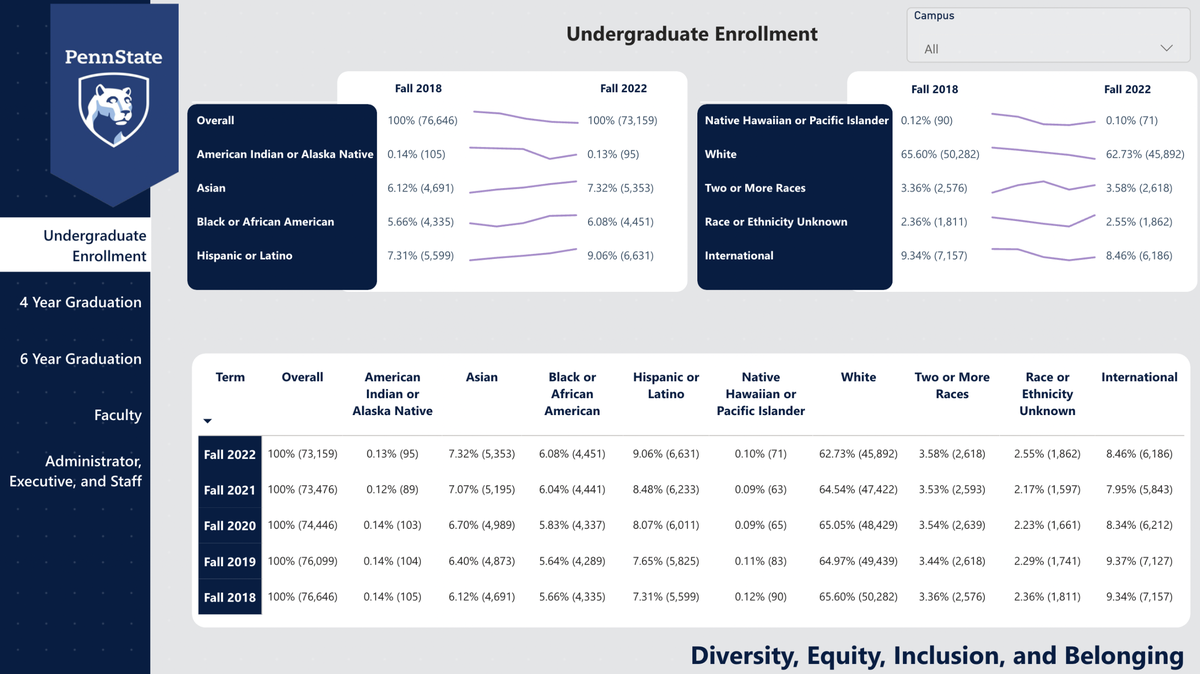
According to the university’s newly released dashboard, Penn State’s undergraduate enrollment boasts a similar diversity profile to its faculty.
About 63% of Penn State’s undergraduates, or 45,892 students, enrolled for the fall 2022 semester identified as white, down from roughly 66% for the fall 2018 semester. Hispanic or Latino undergraduates rank second with 6,631 students for the fall 2022 semester, comprising approximately 9% of the undergraduate student body across all campuses. International undergraduates represent about 8.5% of the pie with 6,186 students last fall, while Asian undergraduates (7.3%, or 5,353 students) and Black or African American undergraduates (6.1%, or 4,451 students) follow closely behind.
Overall, undergraduate enrollment has steadily decreased since 2018, according to university data. Enrollment in the five-year sample peaked with 76,646 undergraduate students for the fall 2018 semester before observing a reduction each subsequent year. The fall 2022 undergraduate enrollment of 73,159 students marks a 4.5% decrease compared to 2018.
Hispanic or Latino undergraduate students saw the largest demographic increase between the fall 2018 and 2022 semesters, representing an 18.4% jump. Hispanic or Latino-identifying individuals now make up about 9.1% of Penn State’s undergraduates, up from 7.3% in 2018.
Asian undergraduate students (14% increase) followed closely behind with a significant gain in representation. By the fall 2022 semester, they comprised about 7.3% of Penn State’s undergraduates, up from 6.1% at the beginning of the five-year sample.
Several racial and ethnic groups saw their enrollment decline across the five-year sample. Despite losing just 19 students, native Hawaiian and pacific islander-identifying undergraduate enrollment observed a 21% decrease from the fall 2018 semester to the fall 2022 semester. International undergraduate enrollment dropped by 13.6%, a loss of approximately 1,000 students.
While white students still comprise the majority of the undergraduate student body, the university observed an 8.7% decrease in their enrollment between 2018 and 2022 — a drop of about 4,400 students.
Although undergraduate enrollment has declined between 2018 and 2022, Penn State’s graduation rates have generally improved, according to the dashboard.
Overall, 57.6% of Penn State’s full-time undergraduate students starting in 2018 completed their bachelor’s degree within four years. That’s a significant improvement over those who started in 2014 and produced a four-year graduation rate of 54.5%.
Roughly 74% of full-time undergraduate students who started their degrees in 2016 completed them within six years, according to the dashboard. Earlier, about 71% of 2012’s cohort finished their degrees within six years.
Among those starting degrees in 2016, about 82% of international students, as well as those who did not specify their race or ethnicity, finished their degrees within six years. Those rates led all demographics featured in the dashboard, checking in before white students (76%) and Asian students (74%).
Approximately 53% of Black or African American students starting degrees at Penn State in 2016 finished them within six years, marking an improvement over the 49% rate observed for the 2012 cohort. Both rates rank lowest among the dashboard’s featured demographics.
A 2023 study conducted by Gallup and the Lumina Foundation supported those observations by concluding Black college students have lower six-year degree completion rates than any other group due to racial discrimination. The study pointed to potential causes and factors including, but not limited to, high costs of education, external responsibilities (such as full-time work or care-giving needs) and discrimination that could lead them to abandon higher education goals entirely.
Graduation rates also varied between campuses. About 85% of students in the 2016 cohort who started their degrees at University Park completed their degrees within six years. That figure drops to 62% for Commonwealth Campuses and just 32% for Penn State World Campus, the university’s online-only degree program.
Diversity varies between administrators, executives and staff
Although diversity has grown in some areas among Penn State’s non-faculty employees, dashboard data suggest the university’s improvements are largely limited to staff, not administrators or executives.
White-identifying employees comprise the vast majority of Penn State’s administrators, executives and staff, according to the university’s dashboard. For the fall 2022 semester, white employees represented about 83.2% of all non-faculty workers at Penn State. The workforce for the fall 2022 semester boasts 167 more white-identifying employees than it did in 2018, but the proportion remains about the same thanks to a 1.5% increase in administrators, executives and staff over the five-year span.
About 8% of fall 2022 administrators, executives and staff, or 1,105 employees, did not specify their race or ethnicity, marking the largest non-white demographic among the data set. Black or African American employees follow with a 2.83% share of the pie, up slightly from comprising 2.74% of the workforce for the fall 2018 semester.
Native Hawaiian and Pacific islander-identifying administrators, executives and staff saw an 80% increase in population between the fall 2018 and 2022 semesters. The number of non-faculty employees identifying as multiracial increased by about 61%, falling well ahead of Asian-identifying employees, whose population grew by 32% over the five-year span. Hispanic or Latino-identifying employees saw their population grow by nearly 27%, but Black or African American administrators, executives and staff grew by just 5%.
Greater racial and ethnic disparities exist when breaking the dashboard’s data down between administrators, executives and staff. For example, Penn State did not employ any administrators or executives identifying as American Indian or Alaska native or of international origin between the fall 2018 and fall 2022 semesters. Just 21 Asian-identifying employees, 21 Hispanic or Latino employees and 31 Black or African American-identifying employees comprised the university’s 392 administrators and executives for the fall 2022 semester. White-identifying employees led the way with 287 administrators and executives.
About 92% of Hispanic or Latino and Black or African American non-faculty employees work as general staff, according to the dashboard’s fall 2022 semester data. Roughly 97% of Penn State’s white-identifying employees, or about 11,300 people, work as staff members, though white employees still comprise the majority of university administrators and executives.
Data collected by the College and University Professional Association for Human Resources in 2020 suggested barriers to entry, including workplace discrimination and increasing educational costs, may play a role in preventing minority candidates from successfully landing jobs as administrators and executives at colleges and universities.
What’s next for Penn State?
The university dashboard does not necessarily feature new data, but it does mark the latest step in Bendapudi’s “vision for the future.”
Penn State’s president said she will host a virtual town hall in March to discuss the dashboard and her plans to increase diversity, equity and inclusion. Key goals in her five-part vision include supporting student success, increasing diversity and improving the university’s internal operations.
Bendapudi said the newly released dashboard should improve accountability as Penn State works toward making good on its promises. The university’s Office of Planning, Assessment and Institutional Research said the dashboard could later add information for additional demographics, including sexuality and disability status, to expand its scope.
“We are a large, complex university and part of what we need to do is really look at ourselves and say, ‘What are things that are working, not working?’” Bendapudi told the Centre Daily Times Feb. 27. “We are under no illusion that, overnight, everything will change. But by holding ourselves accountable and reporting on this every year and looking at our progress, the hope is that we can all see what changes are being made.”
This story was originally published March 2, 2023 at 12:12 PM.
%202.JPG)